













English
Keywords: How FFT Spectrum Analysis Works in Cable Eccentricity Gauges | Extrusion Line Fault Detection Equipment - DALA Metrology
On many cable production lines,experienced operators rely on more than just the numbers on an instrument to judge line conditions.
They listen beside the extruder, watch whether the haul-off runs smoothly, and observe whether the cable shows any regular vibration. Experienced operators can sometimes even hear that something is not quite right from the rhythm of the machine.
A change in sound, an irregular rhythm, or a recurring abnormal noise can all indicate that something in the production process is changing.
This kind of experience is valuable, but it also has limitations。
Production environments are noisy, with sounds from different machines overlapping. The same abnormality may also be interpreted differently by different people. More importantly, an experienced operator may sense that “a certain rhythm keeps repeating,” but hearing alone cannot easily answer questions such as:
How many times per second does this fluctuation repeat?
How large is the corresponding dimensional variation?
Does it more closely match the operating cycle of the extruder, haul-off, or another rotating component?
After machine adjustment, has the problem actually improved, or is it simply no longer audible for the moment?
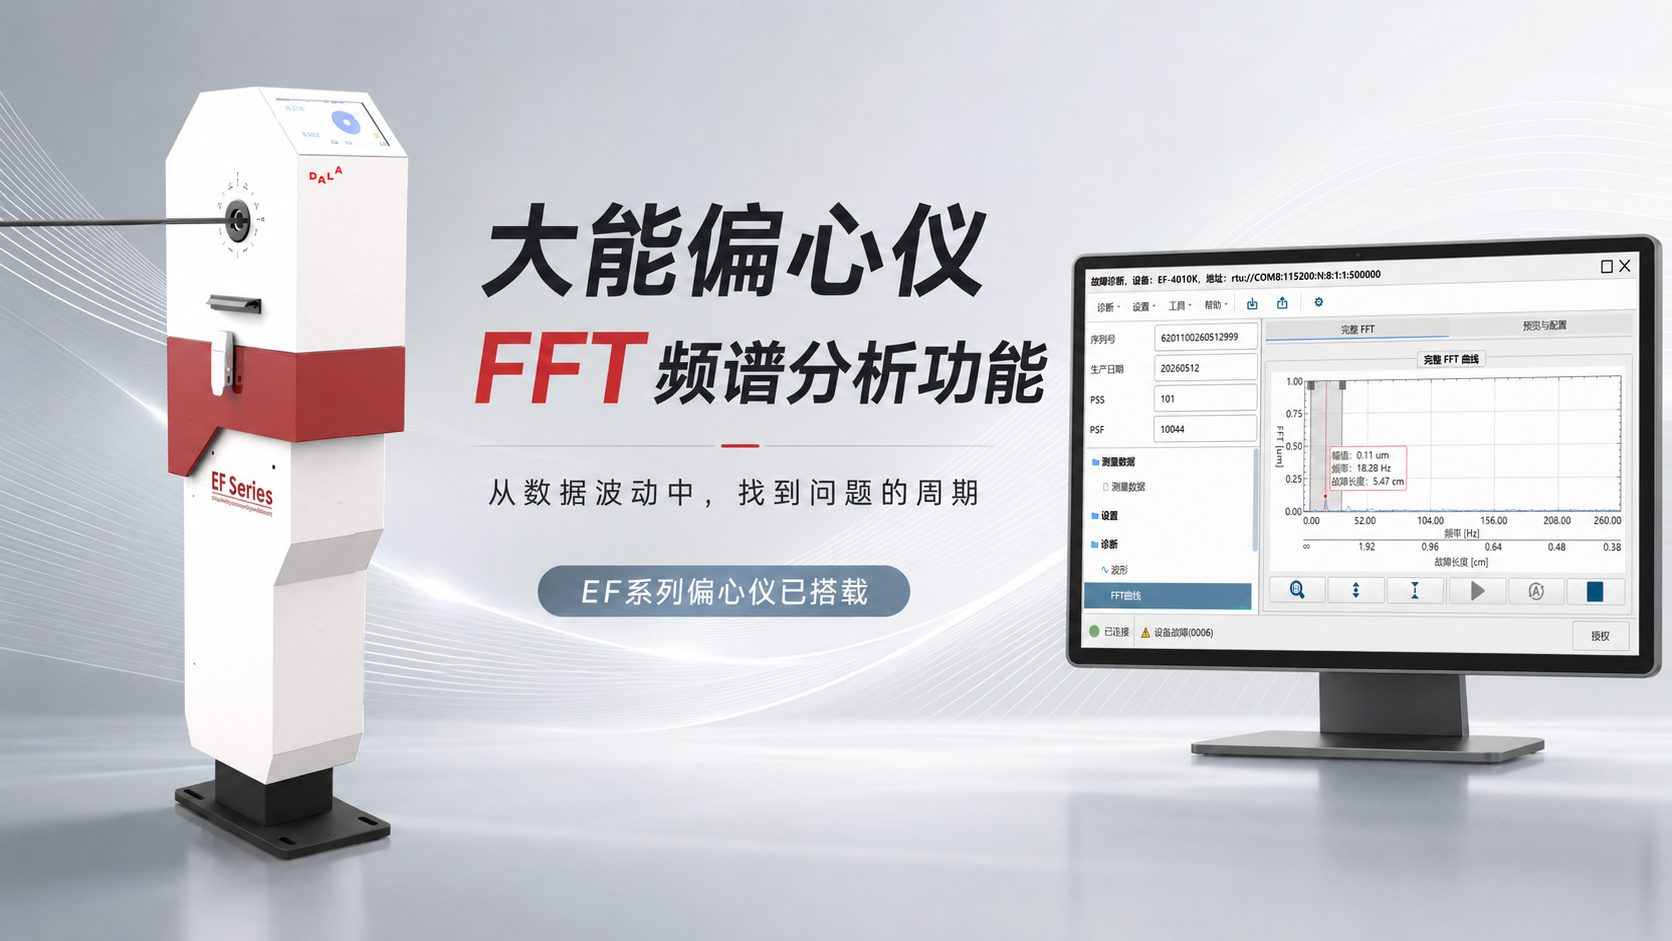
This is also why DALA Metrology introduced FFT spectrum analysis into its EF Series eccentricity gauges 。
We want measurement equipment to do more than record that the data has changed
It should also help production teams see:whether the change follows a pattern, and where that pattern may be coming from.
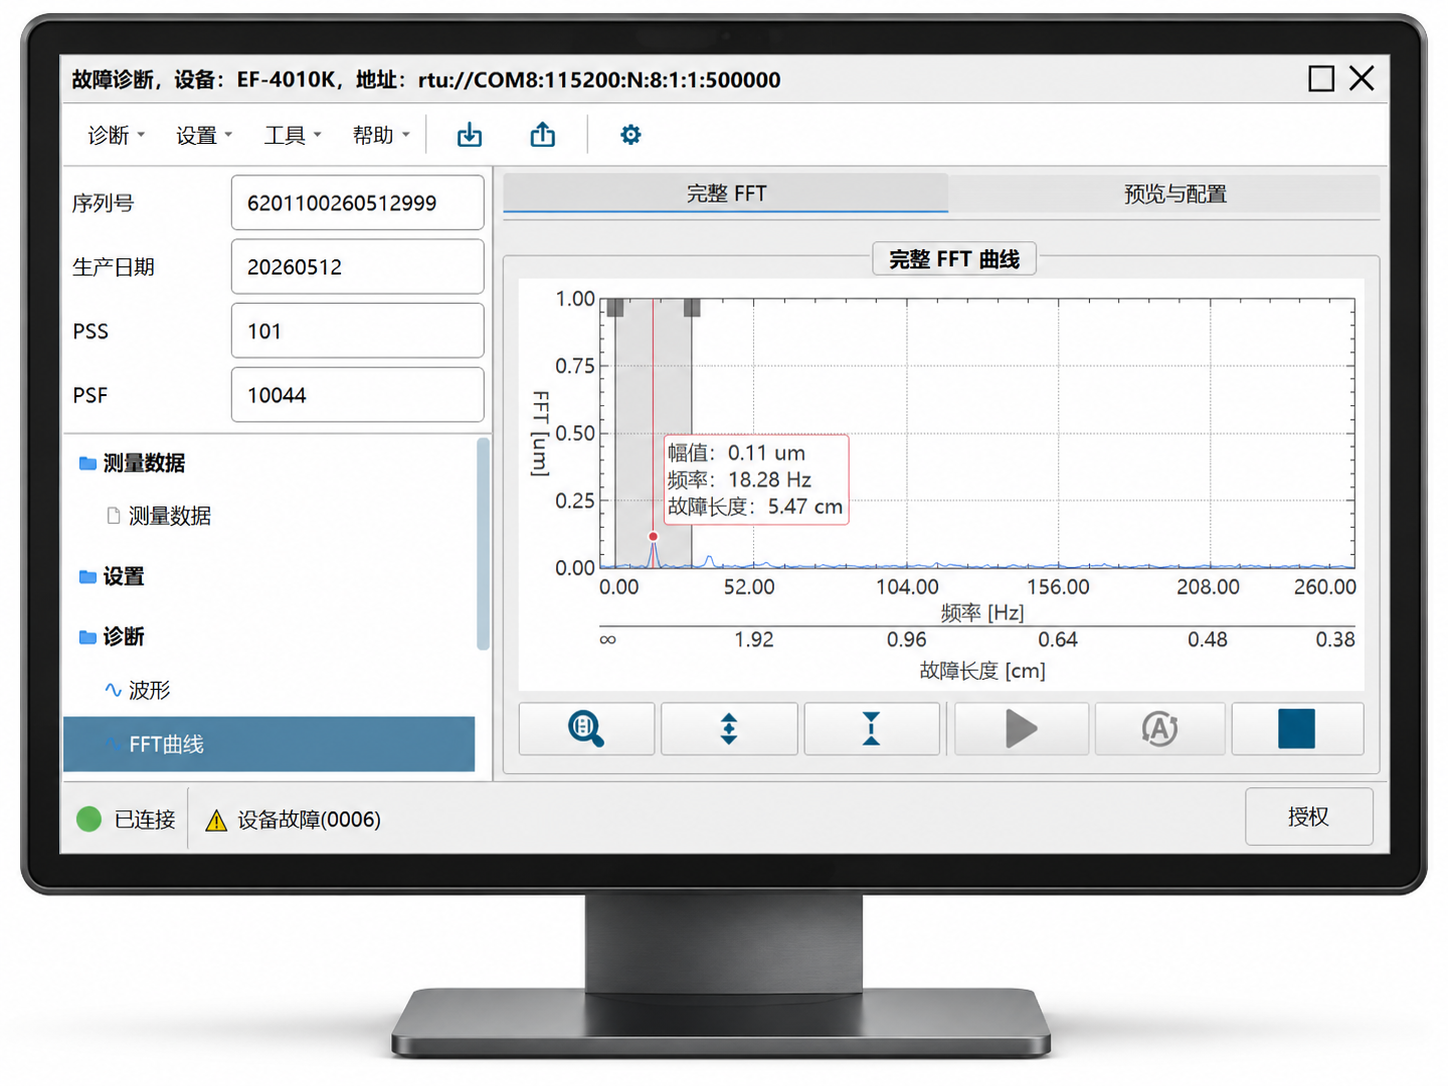
During cable extrusion, parameters such as outer diameter, wall thickness, eccentricity, and ovality can all be affected by multiple factors. A conventional time-based trend curve can show engineers when a value rises or falls.
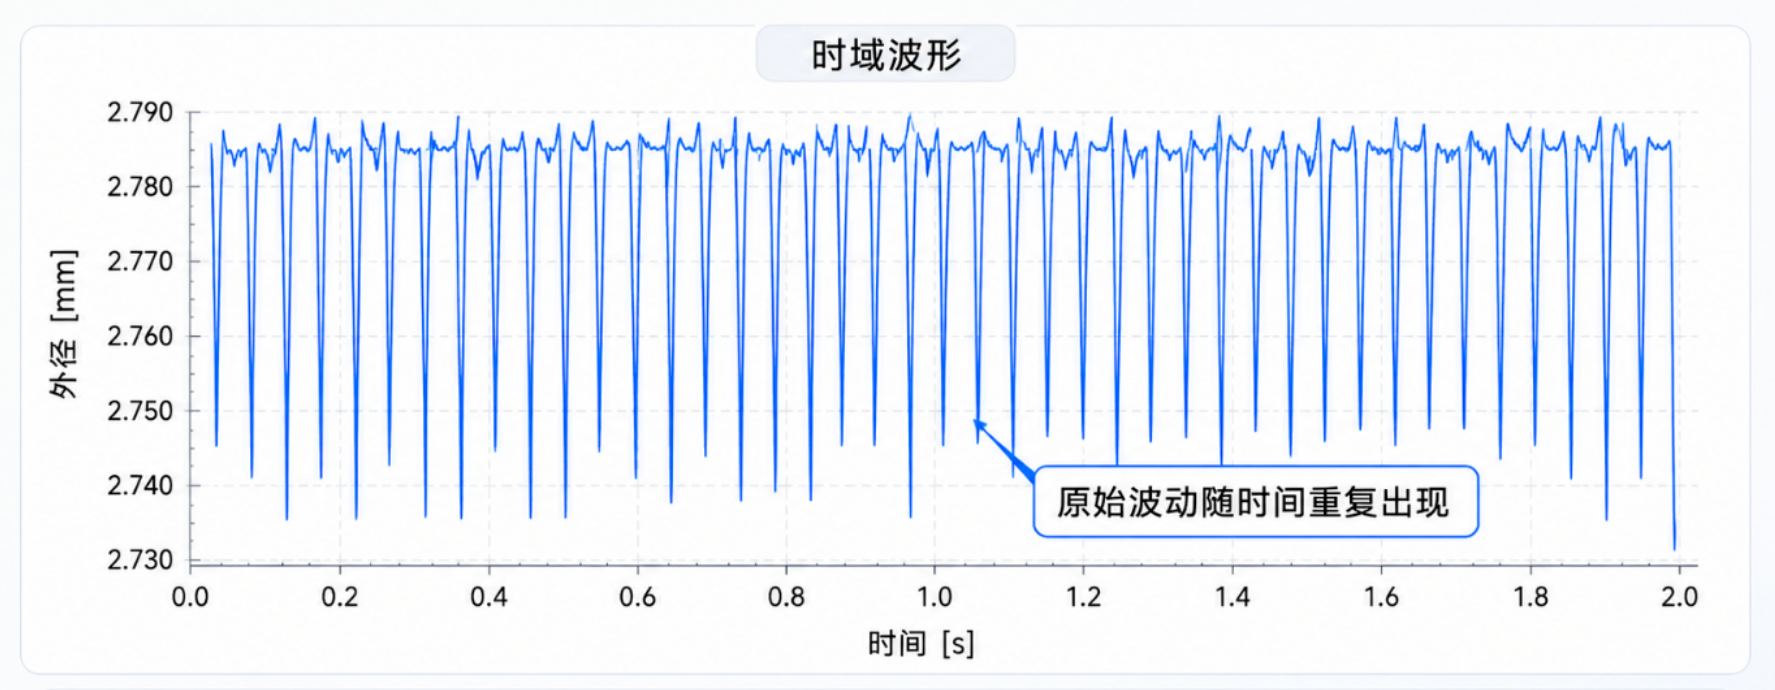
— Conventional Time-Domain Plot —
In real production, however, data is rarely this tidy. Slow drift, material changes, random interference, and equipment-related periodic fluctuations are all mixed into the same curve. Even when the curve is constantly moving, it is difficult to tell by eye whether a stable, repeating pattern is hidden within it.
FFT stands for Fast Fourier Transform
It can be thought of as a “prism” for data analysis. Just as a prism separates white light into different colors, FFT separates mixed measurement fluctuations into components with different frequencies.
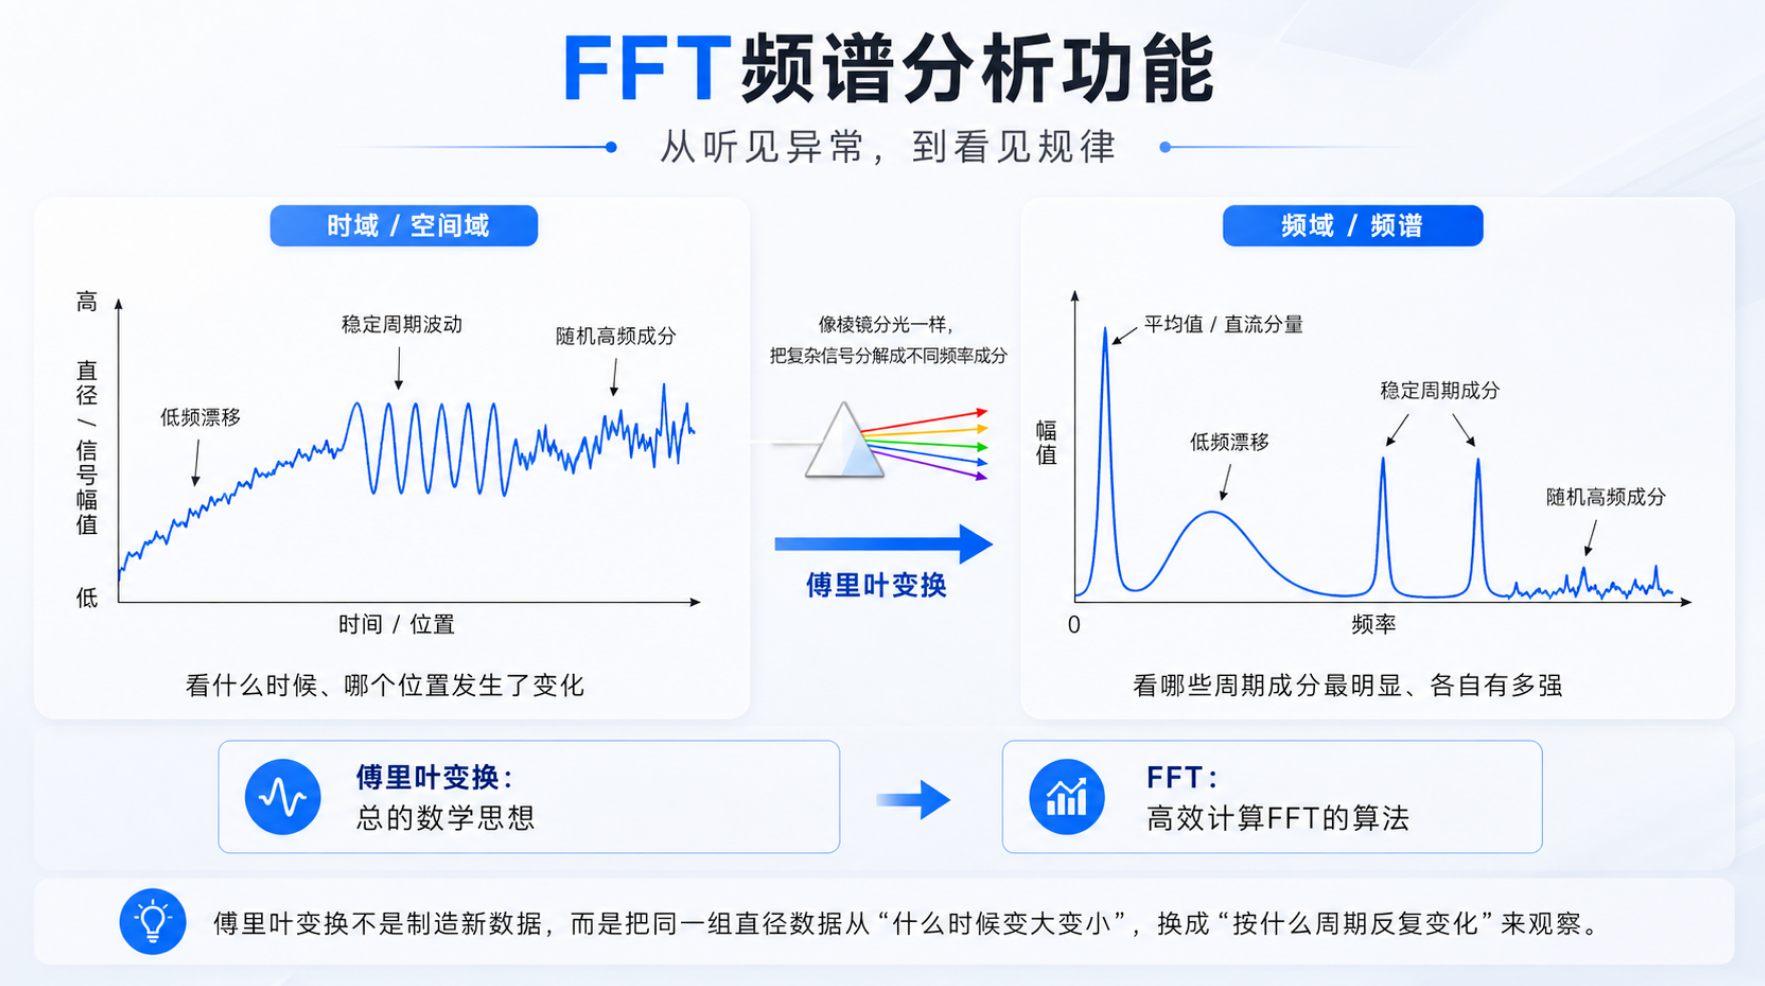
The original curve tells us:when the data changed.
The FFT spectrum goes a step further and tells us:which changes are repeating at a fixed rhythm.
What Can the Spectrum Really Tell You on the Production Floor?
What should you look for in a spectrum generated by FFT analysis?
One key parameter is Peak Frequency
It represents how frequently a particular fluctuation repeats.
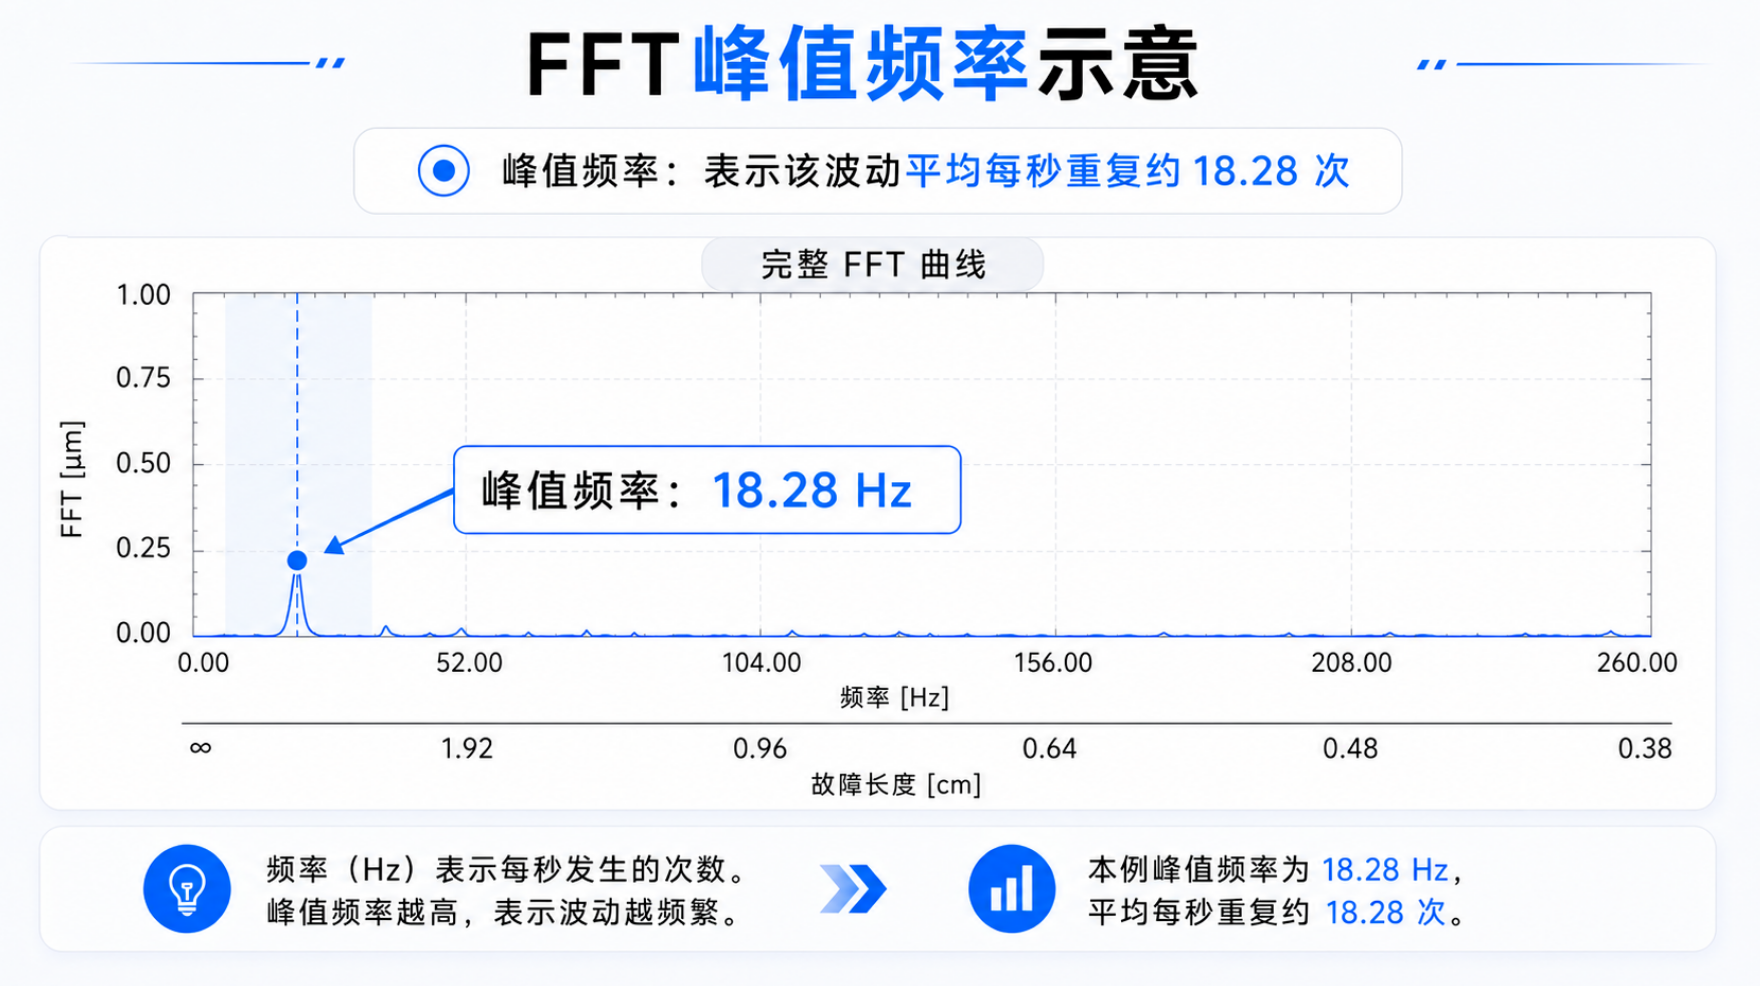
Another key parameter is Peak Amplitude
It represents the magnitude of the dimensional variation at that frequency. The higher the amplitude, the more pronounced the periodic fluctuation.
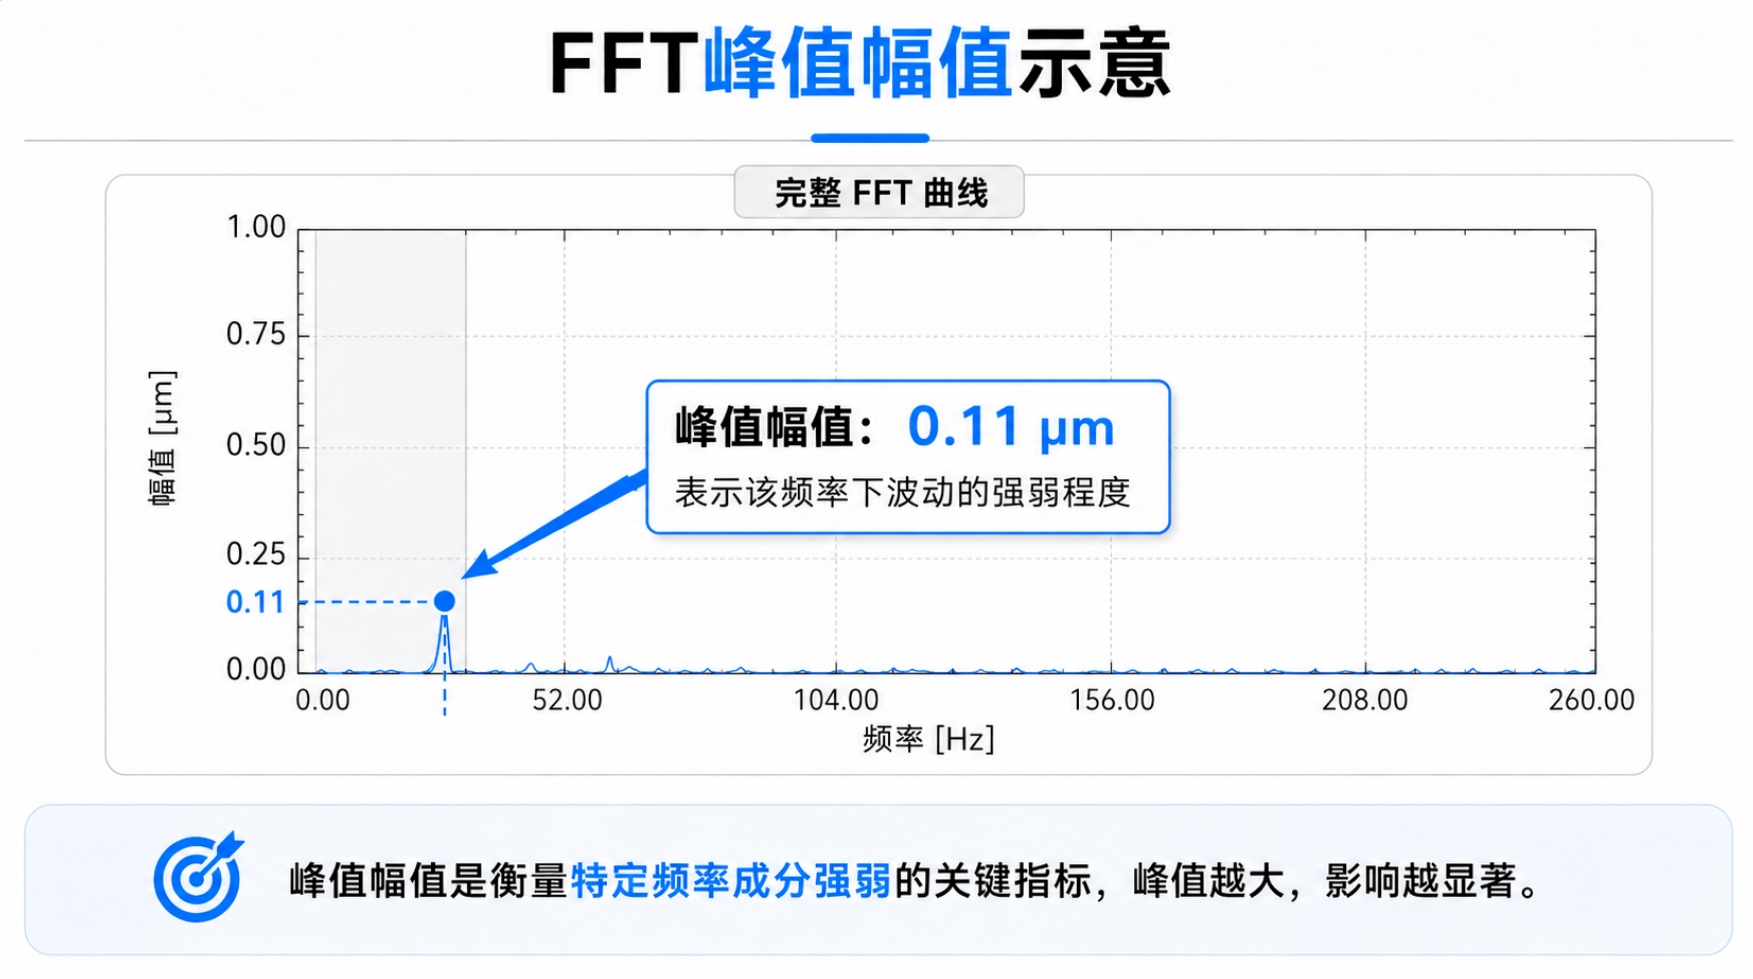
In this way, the “rhythm” that could previously only be sensed through experience becomes something that can be observed in data:
How often does it repeat?
DALA Metrology EF Series eccentricity gauges can currently perform FFT analysis on eight data channels, including diameter, ovality, four single-axis diameter channels, eccentricity, and wall thickness, and automatically output the frequency and physical amplitude of the main peaks. The system also supports multi-frame power averaging to reduce random noise and make persistent periodic peaks clearer.
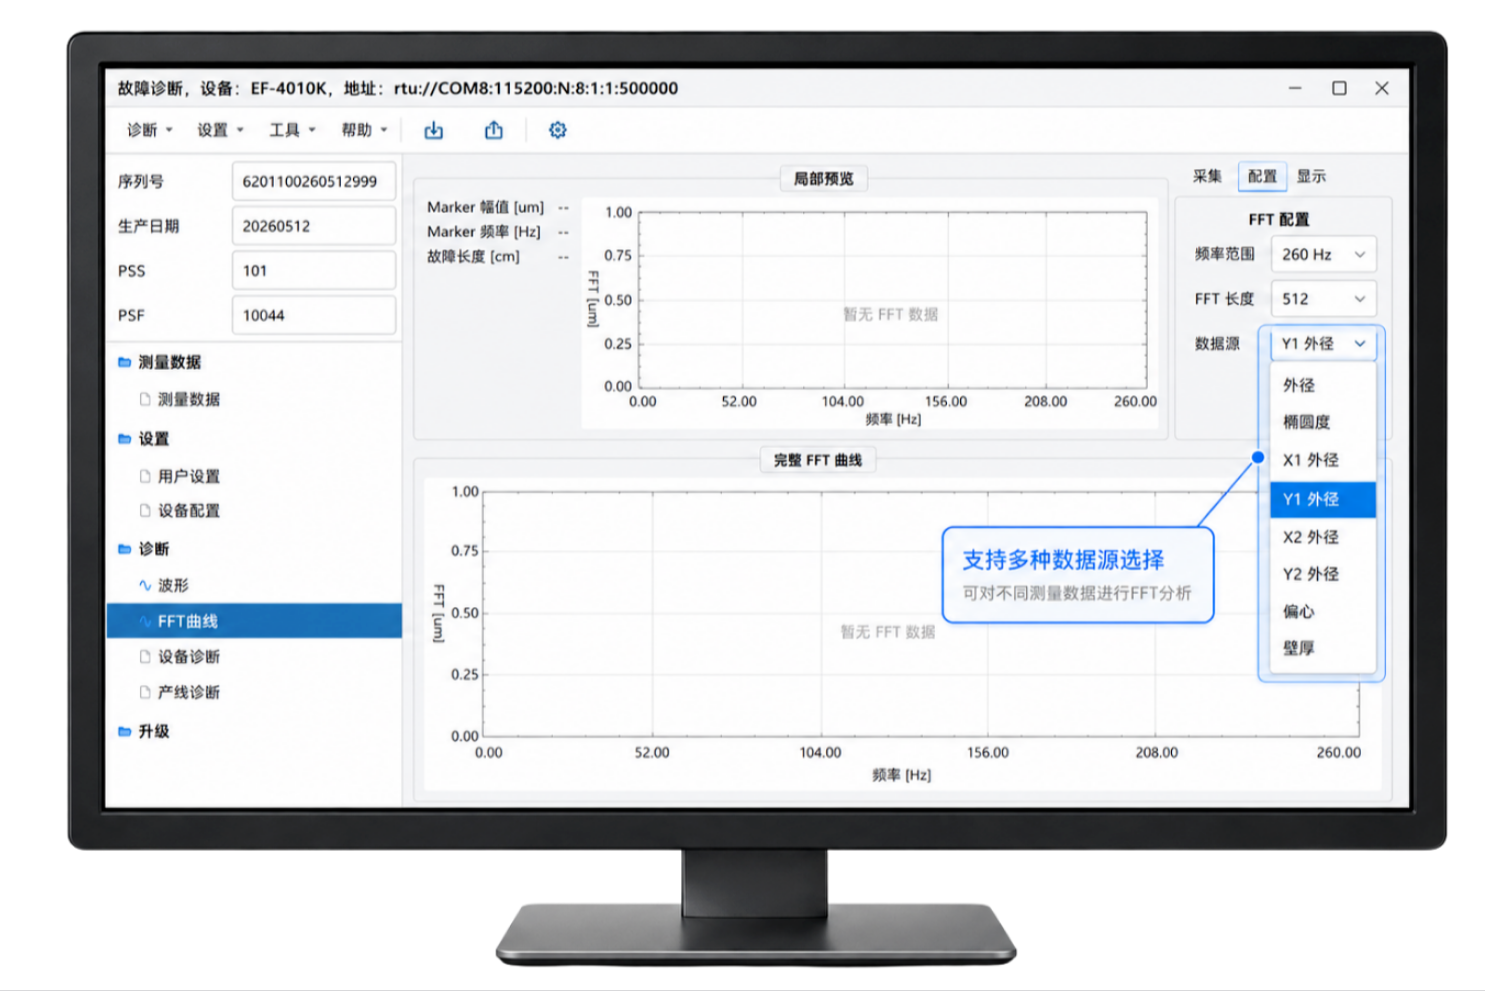
From Detecting an Anomaly to More Targeted Troubleshooting
The most direct value of FFT is not to make the diagnosis for the production team, but to help engineers narrow down the troubleshooting scope more quickly
If a stable peak persists in the spectrum over time, engineers can compare that frequency with the operating parameters of equipment on the line:
Is it close to the operating frequency of the extruder screw?
When the operating frequency of a particular machine is close to an abnormal peak in the measurement data, the production team can prioritize that part of the process instead of checking every machine across the entire line one by one.
By combining the frequency with line speed, the time-based repetition frequency can also be converted into a repeating length along the cable. In other words, you can determine not only “how often” the issue occurs, but also approximately “how far apart” each occurrence is along the cable.
After equipment adjustments, FFT can also be used to compare the results before and after the adjustment.
If the peak and amplitude at the corresponding frequency decrease significantly, it indicates that the original periodic fluctuation has genuinely improved. If the peak remains, the production team can continue investigating other possible sources.
In practical cable production, the value of FFT can be summarized as follows:
Detect periodic problems earlier, narrow down the troubleshooting scope faster, reduce trial-and-error machine adjustments, and provide data-based evidence for evaluating adjustment results.
Starting with Eccentricity Gauges: Putting More Measurement Data to Work in Process Analysis
FFT spectrum analysis is currently available on DALA Metrology EF Series eccentricity gauges, where it can analyze multiple measurement parameters including diameter, ovality, eccentricity, and wall thickness.
When recurring periodic fluctuations appear in production data, FFT can help engineers identify the dominant fluctuation frequencies and amplitudes, then compare them with equipment operating parameters to support troubleshooting and verify the effectiveness of machine adjustments.
Going forward, DALA Metrology will also introduce FFT functionality into more online measurement products, including diameter gauges.
High-frequency measurement data such as outer diameter and ovality will then be used not only to determine whether dimensions are out of tolerance, but also to observe periodic fluctuations and analyze the production process, helping users detect problems earlier and troubleshoot them more systematically.
From eccentricity gauges to diameter gauges, and from displaying measurement results to identifying patterns in the data, our goal is to make online measurement data more useful for real production decisions.
DALA Metrology: See not only the measurement result, but also the pattern behind it.
end
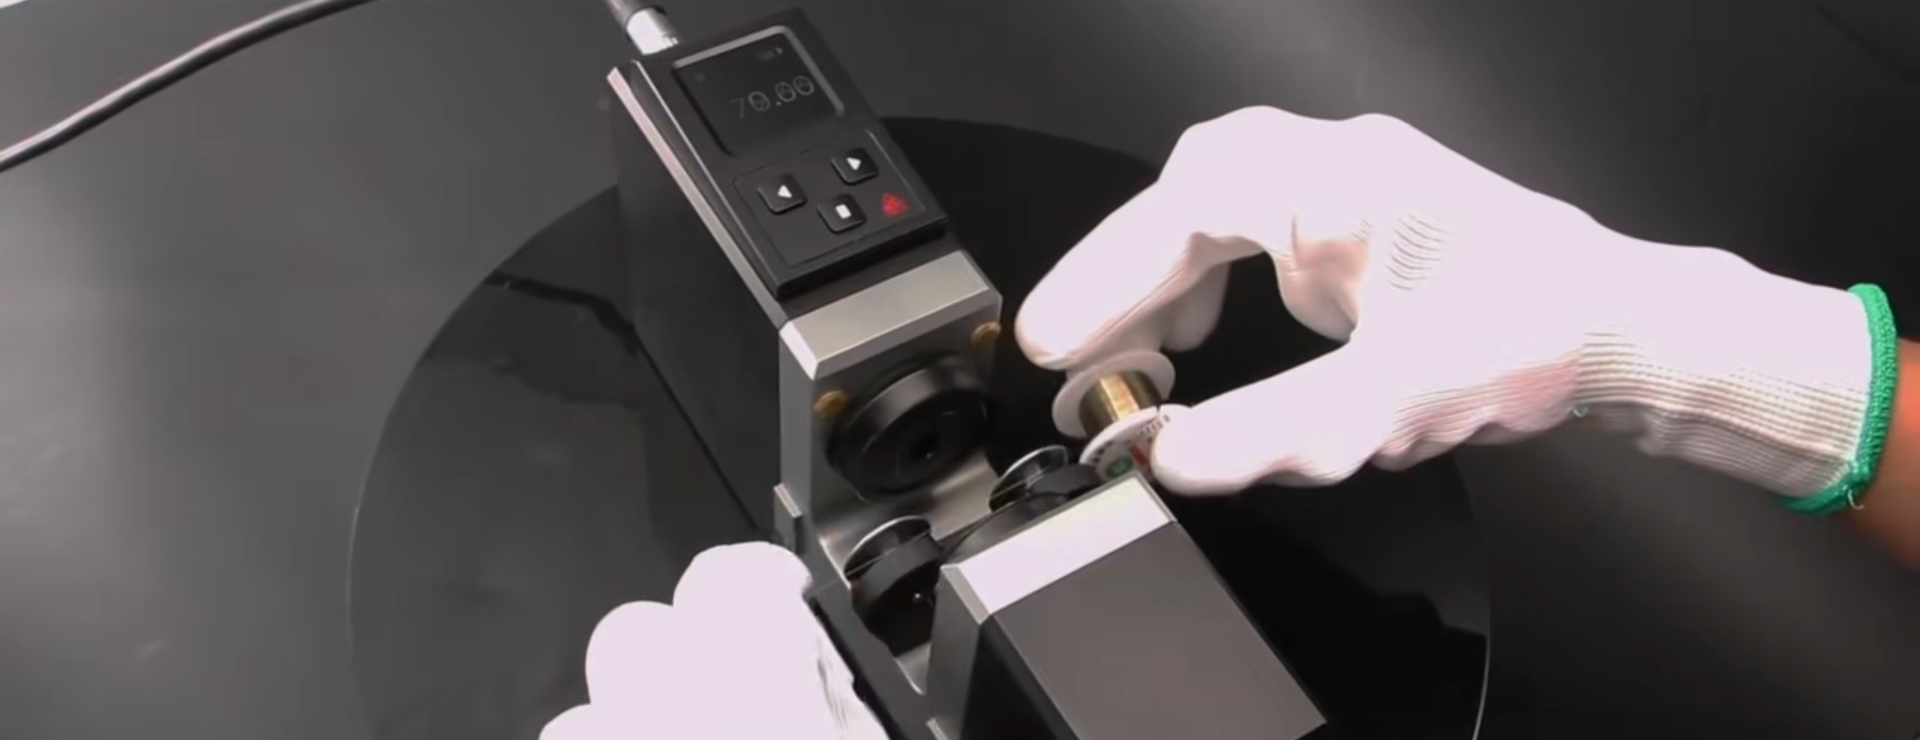
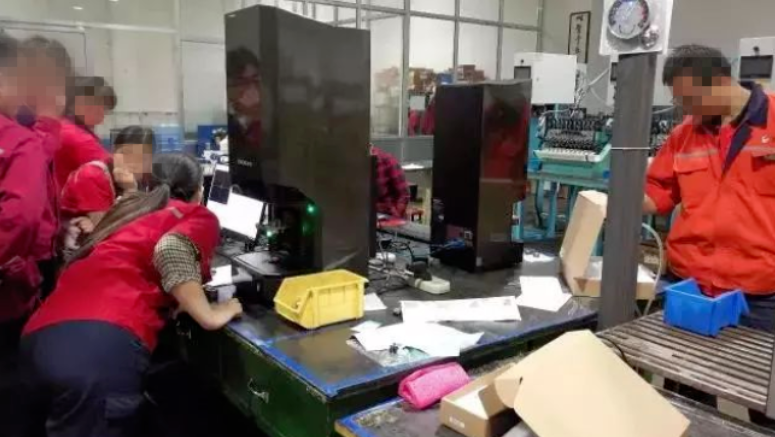
Provides end-to-end support from product selection to production line operation through on-site guidance and after-sales technical support.